05 Oct Understanding Financial Model and KPIs for mobile apps – A definitive Guide
KPIs are the ultimate indicator for how well you Mobile app is doing. KPI stands for Key Performance Indicator. The first rule of KPIs is that they need to be the “key indicators” of your business model and should always relate to the financial model directly.
Why? Because you want to quantify and improve these KPIs to help your company earn more money or get more users.
The main goal of any app is either to make the sure users are using the app frequently or they are paying frequently. Hence it is hard to make a lot of profits from Utility apps like Calculators. These apps are really good but the overall usage is quite low and hence the Business Model will not make sense to build a company around these use-cases.
Based on these metrics we can then define how much money the apps can make.
Let’s define the KPIs first:
Retention Rate
Retention Rate is the most important metric for a mobile app. This defines the “percentage” of users that are still using the app after a certain time has passed.
For example: If your app has 1000 user signed up. After one month you check how many users have opened the app in the second month. So in second month if 300 users have opened the app then you retention rate is defined as :
300/1000 = 30%
So the retention rate is 30%. Industry average is around 15% to 60%. Mobile apps like Facebook, Instagram & watsapp have a retention rate of over 70% hence they have these insane valuations.
Conversion Rate:
This metric is useful for mobile apps that offer a Subscription Model. Conversion rate in this scenario means how many users are converting to paid subscribers.
For example: From the 300 Monthly Active Users(MAU) if 60 pay and become your subscribers then your conversion rate can be calculated as:
300/60 = 20%
Hence you have a 20% conversion rate. Industry average is around 10%. The Harvard Business Review found that even a 5% increase in retention could increase revenues by 25% to 95%.
Cost Per Acquisition(CPA)
Cost Per Acquisition is defined as the average cost to acquire a user. This cost must be averaged out over long periods spanning multiple months to get the big picture.
The other KPI metrics will help you understand how valuable is your app. But CPA defines if your app makes sense in terms of a viable business.
There are various channels for acquiring users:
- Ads (Google, Facebook, LinkedIn, Twitter, SnapChat, TikTok, Apple etc.)
- Influencer Marketing
- SEO/Blog Content
- Directory Listings (ProductHunt, BetaFy etc.)
- Community Forums
- Direct Advertising (Podcasts, Rent Websites etc.)
- And hundreds more
Lets see how all these numbers fit in a Financial Model:
The model is quite straightforward once you have the KPIs.
In the below example we are looking at apps that earn from Subscription or Monthly Recurring Revenue.
Now let’s look at apps that earn from Subscription only.
In this model we are also making an assumption that people are willing to pay for the service and a significant number of users exist that are willing to pay for the service you are providing. This is what truly a startup does, finds a service people are willing to pay for and make sure that there is a large number of users willing to pay for this service. If you have this then you have a great business that investors will be happy to invest in.
We will look at an app like Pocket.
Assumptions:
Retention Rate: 30%
Conversion Rate: 10%
Monthly Subscription Cost: $4.99
CPA: $1/-
To get 1000 users we spend
Number of Users * CPA = 1000 USD
Monthly Active Users
Total Users * Retention Rate
1000 * 30% = 300 MAU
Subscription earning from MAU
MAU * Conversion Rate * Average Subscription Cost
300 * 10% * 4.99 = 149.7
Yearly Subscription earning
149.7 * 12 = 1796.4
Profits
$1796.4 – $1000 = $794.4
So, if we spend 1000 dollars we earn a profit of 794.4. If you can scale this system to 100,000 users then your yearly profits become: $794,00.4. This is a pretty good & viable business model that investors will be ready to invest in to help you scale.
Pocket had around 20 million users in 2015. So if we plug the numbers in the above model we get a yearly revenue from 20 million users at $15,888,000 (over 15 million dollars). Pocket app got acquired for around 30 million by Mozilla Foundation.
SaaS usually have a retention rate of over 80%. Retention like this is required as the Cost Per Acquisition is pretty high. That’s why you will see SaaS companies offering $10 to $1000 referral commission.
Now let’s look at apps that earn from Ads only.
For advertising based apps the most important number is Total Users & Retention.
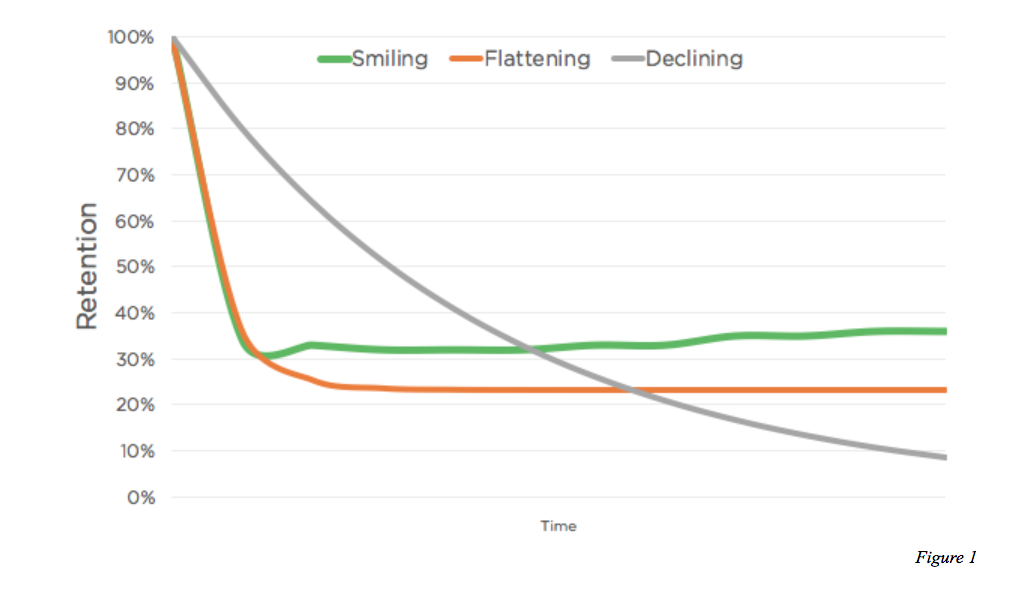
In mass consumer apps finding the total retained users is a bit tricky. These apps only make sense if the Retention Curve is a “Smile” curve like this:
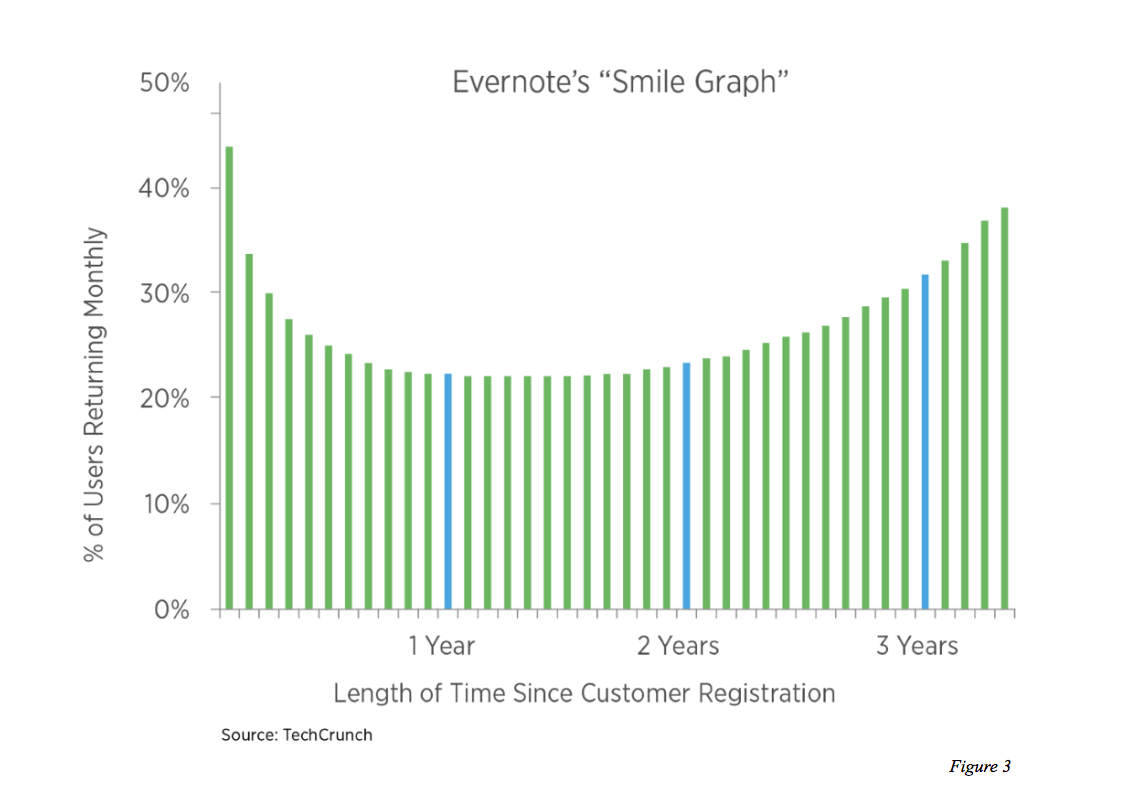
This below retention graph is an example of long tail retention. Where some percentage of your users choose to stick around for a longer time and hence make the financial model viable.
You can use Retention curve graph to find if you Product Market Fit. I should probably write an article on understanding retention rates.
In any case we assume the overall retention assuming you has a smile graph and your long tail users are sticking around and using the app. For this use case this is what the financial model will look like.
Let’s look an app like FlipBoard:
Assumptions:
Retention Rate: 15%
Average Earning from Ads/user/month: $0.5
CPA: $0.5/-
To get 1000 users we spend
Number of Users * CPA = $500
Monthly Active Users
Total Users * Retention Rate
1000 * 15% = 150 MAU
Ads earning from MAU
MAU * Average Earning From Ads Per User
150 * $0.5 = $75
Yearly Ads earning
75 * 12 = 900
Profits
$900 – $500 = $400
Earning per user overall: $0.4 per year
Here we reduced the cost of customer acquisition to make sense of the model to $0.5. Unless you are able to achievea much lower CPA, advertising model will not work. Also ads based models only work for large number of user.
FlipBoard has around 145 million Monthly Active Users. So putting these numbers into the above financial model we get their yearly revenue to be around:
MAU * Average Earning from Ads/User * Months In Year
145 million MAU * $0.5 * 12 = $870 Million
The above model should be taken with a grain of Salt. This is a good model for “predicting” the possible outcome and usually at really large scale it depends on the business on how they chose to monetize.
Usually mobile apps with such large number do direct deals with advertisers and are able to increase their annual earning. Flipboard doesn’t have an advertising platform like Facebook and deals with large advertisers/big companies directly.
In some cases the goal is not just to increase the annual ads expenditure but maintain a consistent influx of ads revenue. This is a model followed by FlipBoard. They usually do month long or year long deals with Big Brands to have a consistent cash flow.
The other big factor that defines how much you can charge for ads is the type of users you have. For apps like tiktok, most users fall in younger category and hence ads targeted at younger audience. These users have a lower monthly earning and are not that attractive to advertisers unless they can reach a really large number of users.
LinkedIn can charge more for its ads as the users using the platform are mostly professionals. It is very hard to find professionals to advertise to on the Internet. This is what Microsoft saw when they acquired LinkedIn for $26.2 Billion.
How to use this Model
So this was a guide on creating a Financial model for mobile apps. To use the above strategy to provide a more realistic model try to make your assumptions based on real world data.
Before starting you should ask these questions:
- Are user willing to pay for your service?
- How much are they willing to pay?
- How many users are there that you can realistically reach?
If you have answers to these problems that you can create a much more realistic model. It is very easy to validate your idea even before starting. Find your potential paying customers and ask them if they would want a service like this and they are willing to pay for this.
Hope you like this guide and I hope it provides a framework for your startup. Wish you all the best.
Let me know in the comments what you think.
Pingback:Generate Embeddable HTML code for any URL using Pipfeed's Extract API - PipFeed.com
Posted at 09:37h, 10 November[…] Understanding Financial Model and KPIs for mobile apps – A definitive Guide – System.Cam… […]